Both a heat release time curve and a listing of the' peak
and total integrated heat release should be secured from the experimental
data. They should be corrected for the non-linearity of the heat release
calibration curve.
The curve of the millivolt signal from the stack thermocouples
should include at least 30 s of the initial 3 min steady state verification
period as well as the starting transient just prior to and following
specimen insertion. In converting millivolt signals to heat release
rate, the zero release level of the calibration curve should be set
at the level of the initial steady state just prior to test of the
specimen involved. See Figure 13.
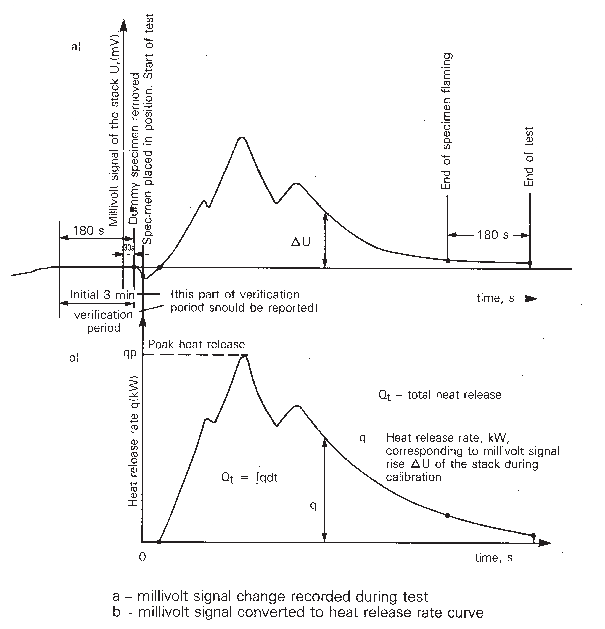
Figure 13 Conversion of the millivolt signal rise ΔU to heat release rate of the
specimen