3.1 This section details
Lloyd’s Register’s interpretation of ISO 6954:2000
Mechanical Vibration and Shock – Guidelines for the overall
evaluation of vibration in Merchant Ships (2000). It should
be used in conjunction with
Ch 6, 6 Assessment accommodation and workspaces based on ISO 6954:2000
.
The analysis is different to that used in ISO 6954: 1984 and
users should ensure that the appropriate version is being used.
3.2 The vibration level
is defined as an overall frequency weighted r.m.s. velocity for all
vibrations within a range of 1 to 80 Hz. Acceleration may also be
used. The weighting functions, from ISO 6954:2000 are reproduced in
Table 3.3.1 Weighting functions for ISO
6954:2000
and
Figure 3.3.1 Weighting functions for ISO 6954:2000.
. The weighting functions
are applicable to all directions.
Table 3.3.1 Weighting functions for ISO
6954:2000
|
Band
|
Velocity
|
Acceleration
|
|
Band
|
Velocity
|
Acceleration
|
|
Hz
|
Wv
|
Wa
|
|
Hz
|
Wv
|
Wa
|
|
|
|
|
|
|
|
|
|
0.20
|
0.002
|
0.063
|
|
10.00
|
0.869
|
0.494
|
|
0.25
|
0.004
|
0.099
|
|
12.50
|
0.911
|
0.412
|
|
0.32
|
0.009
|
0.156
|
|
16.00
|
0.941
|
0.337
|
|
0.40
|
0.017
|
0.243
|
|
20.00
|
0.961
|
0.274
|
|
0.50
|
0.032
|
0.369
|
|
25.00
|
0.974
|
0.220
|
|
0.63
|
0.059
|
0.530
|
|
31.50
|
0.979
|
0.176
|
|
0.80
|
0.098
|
0.701
|
|
40.00
|
0.977
|
0.140
|
|
1.00
|
0.147
|
0.833
|
|
50.00
|
0.964
|
0.112
|
|
1.25
|
0.201
|
0.907
|
|
63.00
|
0.926
|
0.083
|
|
1.60
|
0.261
|
0.934
|
|
80.00
|
0.843
|
0.060
|
|
2.00
|
0.327
|
0.932
|
|
100.00
|
0.706
|
0.040
|
|
2.50
|
0.402
|
0.910
|
|
125.00
|
0.533
|
0.024
|
|
3.15
|
0.485
|
0.872
|
|
160.00
|
0.370
|
0.013
|
|
4.00
|
0.573
|
0.818
|
|
200.00
|
0.244
|
0.007
|
|
5.00
|
0.661
|
0.750
|
|
250.00
|
0.156
|
0.004
|
|
6.30
|
0.743
|
0.669
|
|
315.00
|
0.100
|
0.002
|
|
8.00
|
0.813
|
0.582
|
|
400.00
|
0.063
|
0.001
|
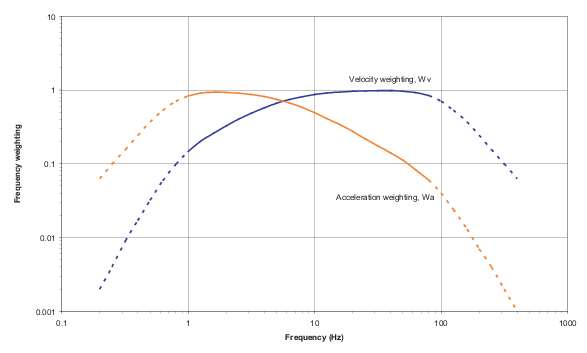
Figure 3.3.1 Weighting functions for ISO 6954:2000.
3.3
Record length
Analysis of recorded measurements should be made for a period
of at least one minute, or two minutes if there are dominant components
below 2 Hz. For unsteady vibrations with significant modulation, such
as structural response to propeller induced vibration forces, it may
be necessary to extend further the measurement and the corresponding
analysis periods in order to derive reliable values of overall r.m.s.
vibration velocity.
3.4
Analysis
options
Analysis of the measured data may be undertaken in either the
time or frequency domains. The availability of portable FFT signal
analysers means that a frequency domain analysis will be preferred
by most vibration engineers. The procedure consists of three steps:
- spectral analysis (constant or proportional bandwith), followed
by
- signal weighting, and finally
- summation of weighted spectral components.
3.5
FFT analyser
settings
Typical FFT parameters for a 400-line analyser are:
- Hanning window
- Frequency range, 0-100 Hz (nearest to 1-80 Hz)
- Sampling frequency, 250Hz
- Number of data in each sample: 1024
- Sample length: 4.096 seconds
- Averaging r.m.s. over 15 samples, no overlap.
3.6
Calculation
of overall weighted value
The overall weighted value is determined from:
Where:
|
aw
|
= |
frequency-weighted
acceleration or velocity. |
|
awi
|
= |
weighted
acceleration or velocity for the i th one-third octave band |
3.7
Direction
The highest value in any direction will be used for assessment.