2.2
Derivation
of Vibration Levels
In order to define the correct procedure for interpretation
of FFT analysis, it is useful to consider how the guidance vibration
levels of ISO 6954:1984 were originally derived.
The measure
of vibration severity used in ISO 6954:1984 is termed the maximum
repetitive amplitude (MRA). The MRA is defined as the largest repeating
value of the modulated signal of a single frequency obtained during
sea trials. The sea trials are to be conducted in accordance with ISO
4867: Code for the measurement and reporting of shipboard vibration
data and / or ISO 4868: Code for the measurement and
reporting of local vibration data of ship structures and equipment.
The usual measuring system employed to collect the vibration
data used in formulating the original guidance limits of ISO 6954:1984
included a chart recorder that provided a paper trace of the vibration
signal. This trace was then manually analysed to determine the MRA
for each significant excitation source.
A representation
of a typical propeller excited hull vibration is shown in
Figure 3.2.1 Maximum repetitive amplitude
. It indicates modulation
of the vibration amplitude due to variation of the propeller excitation
forces. This vibration signal has been filtered to show only propeller
blade passing frequency from which the MRA is readily identified.
The value indicated is the peak-to-peak value, or twice the MRA. This
is the value to be compared with the guidance levels given is ISO
6954:1984.
MRA’s for individual excitation frequencies
can be readily evaluated using a sea trials measuring system that
includes a chart recorder, a tape recorder and precision filters.
However, this is laborious, and an FFT analyser is often used to provide
a spectral analysis of the vibration signal. Unfortunately, as a consequence
of the averaging process used in an FFT analyser, the modulation effects
are suppressed and the MRA is obscured. A direct reading of the MRA
as required by ISO 6954:1984 is not possible and it is therefore necessary
to apply a correction factor in order to estimate the MRA.
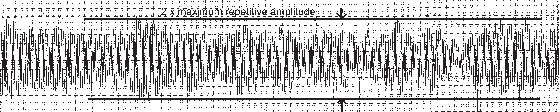
Figure 3.2.1 Maximum repetitive amplitude
2.3
Use of FFT
Analysers
When using an FFT analyser to provide the frequency spectra
of a vibration signal there are, on a typical analyser, three analysis
methods available, namely:
- r.m.s. average
- peak average
- peak hold - not to be used for MRA estimates.
Each of these methods calculates a time-averaged level of vibration
over the recorded signal length and, as a consequence of the averaging
process, the true MRA cannot be directly calculated. Of these three
averaging methods, the analysis procedure that most accurately reflects
the true value of the MRA, as defined in ISO 6954:1984, is as follows:
- Calculate the average r.m.s. value of vibration over the frequency
range 1 - 100 Hz. The record should be at least two minutes long.
- Multiply the average r.m.s. spectral values by a crest factor
of 2.5 for propeller excited vibration to allow direct comparison
with typical chart recorder traces or the ISO 6954:1984 guidelines.
The crest factor of 2.5 comprises:
- A factor of 1.414 to convert from r.m.s. to peak values.
- A tentative conversion factor of 1.8, as proposed in ISO 6954:1984,
to account for the normal modulation of the vibration signal in sea
state 3. The conversion factor is defined as the ratio of MRA to the
average amplitude during steady speed trials.
It is stressed that the conversion factor of 1.8 is a tentative
value that may vary between ships and/or trial conditions. It is therefore
essential that the measuring equipment employed during sea trials
provide a recording of the time based vibration signal, either digitally
or on magnetic tape, so that if required, the true conversion factor
can be calculated. This may be necessary in the event of possible
design problems or questions relating to compliance with design specifications.
For example, structural vibration due to machinery excitation is unlikely
to have the degree of modulation typically associated with propeller
excitation and therefore the use of 1.8 as the conversion factor will
lead to an over estimate of the MRA.
2.4
Recommended
analysis procedure
In the examination or the interpretation process of vibration
signals, the fundamental step is to identify the excitation sources.
For vibrations due to machinery, a factor of 1.414 to convert from
r.m.s. values to peak values is normally adequate to assess the vibration
severity. For propeller induced vibrations, however, a more cautious
approach will be adopted.
In the case where the vibrations
caused by propeller excitation are not considered to cause any complaints
and that the levels are well within design specifications, the use
of a crest factor of 2.5 is acceptable. However, in the event that
the vibration levels are marginally within the design specifications
and that possible problems or argument may arise, the vibration signals
will then be subjected to vigorous examination in order to establish
the true conversion factor. This examination process is:
- to play back the recorded signal from a tape recorder onto an
oscillograph measuring device to obtain a paper trace of the vibration
signal;
- a ‘filter’ will be used during the above play back
process so that only the vibration signals related to the propeller
blade passing frequency will be examined. The filter response and
the bandwidth should be wide enough to capture the quickest modulations;
- the recorded signal on the paper trace should be long enough to
allow the establishment of MRA and the average amplitude;
- the true crest factor will then be calculated from the MRA and
average amplitude.